Monitoring with Prometheus
Prometheus is a monitoring and alerting toolkit. It is build to monitor OS, application or services in highly dynamic container environments. Prometheus stores the monitoring data in a multidimensional time series database.
Prometheus Server
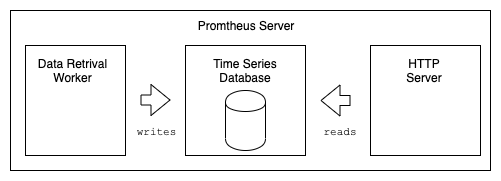
The Prometheus Server main components are:
- Retrieval: The Data Retrieval Worker pulls metrics data from the targets.
- Storage: The Time Series Database stores metrics data.
- HTTP Server: The build in HTTP Server accepts
PromQLqueries and offers a simple web UI to display the data.
Targets
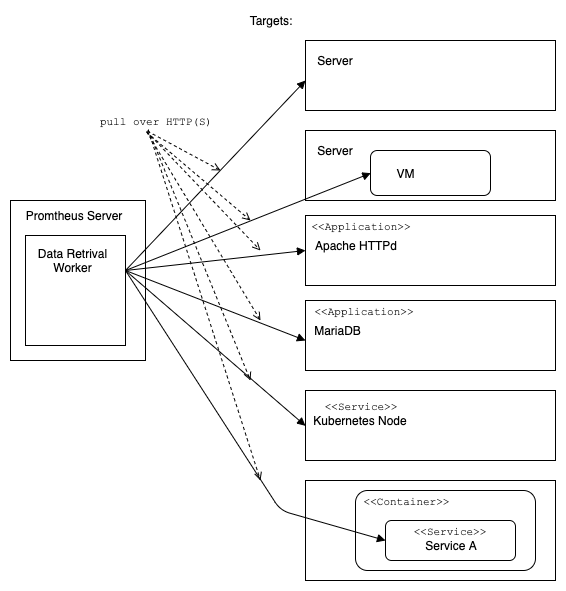
Prometheus monitors Targets. A target is a host/server, a VM, a application (like a Apache HTTPd or MariaDB), a service or a service in a container.
Units
Each target has Units. A unit monitors values like CPU status, used memory, used disk space, number of processes, request counts, request duration, error counts etc.
A Unit is called a Metric. Prometheus has four primary metric types. Every metric entry can have also a TYPE- and a HELP- attribute.
Prometheus Metric Types
Prometheus supports the following metric types:
- Counter, a cumulative metric that represents a increasing counter, i.e. number of served requests, number errors or number of read files.
- Gauge, a metric where the value can go up and down, i.e. memory usage, open database connections or number of open file handle.
- Histogram, a metric to sample observations like request duration or content length.
- Summary, is similar to histogram, but calculated on the client side.
Metric Format
The format of a metric is:
# HELP metric_name Description of the metric
# TYPE metric_name type
# Comment that Prometheus does not parse
<metric name>{<label name>=<label value>, ...}
A detailed data model for metrics can be found at the Prometheus Data Model ↱ page.
Metric Name
A metric name identifies what to count or measure. Typical metrics are:
- http_requests_total, the number of HTTP requests
- process_cpu_seconds_total, a process runs time on cpu
- http_request_duration_seconds, duration of a HTTP request
- http_connections_waiting, number of requests waiting in a queue
The name of a metric should start with namespace prefix. The namespace prefix should identify
to which application or service a metric belongs to. I.e. prometheus_http_requests_total
(Prometheus) or nginx_connections_accepted (NGINX exporter).
Metric Labels
Labels specifying the details of a metric. What exact job, which service and/or for what HTTP response status is counted/measured?
Typical labels are:
- instance, which instance of a service, host:port
- job, a job name or job identifier from prometheus.yml
- endpoint, which endpoint
- path, the path in a URL
- method, HTTP method
- status_code, HTTP status code
- cluster, which cluster part/location
Example Counter:
http_requests_total{status="200", method="GET", path="/login"}
Collects metrics as http_requests_total. It counts the requests answered with the
HTTP status code 200 (status="200"), HTTP method GET (method="GET") and the path ‘/login’
(path="/login").
Metrics and Label Naming best practice
A best practice guide how to name metrics and labels can be found here ↱
Metric Type Attribute
The TYPE attribute of a metric should give a type information of the metric.
Metric Help Attribute
The HELP attribute of a metric should give a short description of the metric.
Metric Comments
It is possible to add comments to a metric.
A complete Metric example
# HELP sample_http_requests_total The total number of HTTP requests to the sample service.
# TYPE sample_http_requests_total counter
sample_http_requests_total 6
sample_http_requests_total{method="GET",status="200",path="/getValues"} 3
sample_http_requests_total{method="GET",status="200",path="/getValue/:id"} 15
Push/Pull
Prometheus pulls (scrape) the metrics from its targets. Push should only be used for short living jobs.
Target Endpoints to collecting metrics data
The Data Retrieval Worker pulls over HTTP endpoint (http(s)://hostname:port:/metrics) the metrics data from the targets. The metrics data must be in the prometheus metrics format.
Exporter
If a application does not support directly the export of metrics itself, a exporter can be used. A exporter is small services which requests the necessary monitoring information from the services and offers them as prometheus metrics. Exporters are avail for a lot of services like PostgreSQL, MariaDB, Redis, NATS, CEPTH etc.. A list of avail Exporters and Integrations ↱
PromQL
PromQL is the query language to query the metrics in Prometheus. See Querying Prometheus ↱
A basic introduction can be found here : Querying Prometheus ↱.
Alerts
It is possible to define alerts and add email/sms/chat- platforms notifications with escalation levels in the Prometheus Alertmanager ↱.
See also
- Monitoring
- Monitoring with Prometheus, Simple Counter Example with Deno
- Monitoring with Prometheus, Simple Counter Example with Quarkus